I have this crazy plan to create an algorithm that’ll automatically buy and sell stocks at times of the biggest opportunity. Winners every time. I know, my goals are small, are they? They don’t call it a magic stock picking machine for nothing!
I’ve written out my goal: My goal is to buy stock in quality companies whose stock price has dropped at least 5% in two days or less and then sell it within 30 days.
…at least that’s the model I’m starting with. How will this hold up to testing? Once we know that we have a goal that is workable, I can focus my attention to tweaking this goal and then create an algorithm flow chart to put the plan into action.
Let’s start on that “5% over two days” entry point. As my friend Done By 40 mentioned in the comments of our post last week, I’m not sure this is an accurate percentage to start at (since I picked it out of the air), so a little test can easily clean that up.
Testing is where the rubber meets the road with theories. If you’re buying a mutual fund for the first time, start tracking it’s progress at sites like Morningstar.com. With testing, you’ll become a better investor no matter how complicated your strategy may be.
Let’s look at some of my past opportunities to see how I would have fared.
British Petroleum (BP)
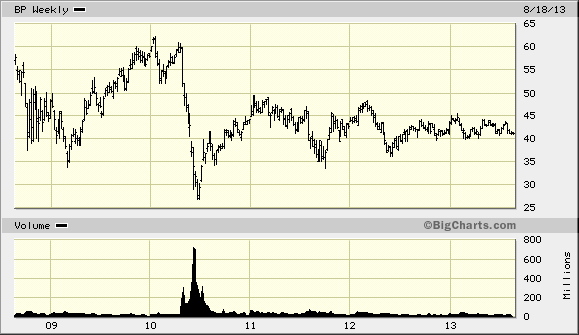
First, let’s explore BP after the oil spill. I did well on this stock initially but held it too long:
This chart comes from BigCharts.com. Here’s a quick plug: even when I was a financial advisor and had some awesome tools at my disposal, I loved this site for it’s user-friendly charts and historical data. When I had to look up past prices of stocks for clients, this was always my first choice. (BigCharts, if you’d like to sponsor this site, please send emails to joe (at) stacking benjamins (dot) com!)
To get to the oil spill I pulled up the 5 year chart. Guess when the spill happened? Ha! Hard to notice that stock price drop or the increase in volume, isn’t it?
Had my “5% rule” been in play, I would have purchased shares of BP at roughly $57 per share. I would have purchased again around $49 per share. I would have purchased a third time for around $29 per share. Of these trades, only one would now be profitable.
Ouch.
Interestingly, had this rule been in effect, I would have also purchased midway through 2011 at around $42.50. Plenty of evidence already that the 5% rule wouldn’t have been my buddy.
Bank of America (BAC)
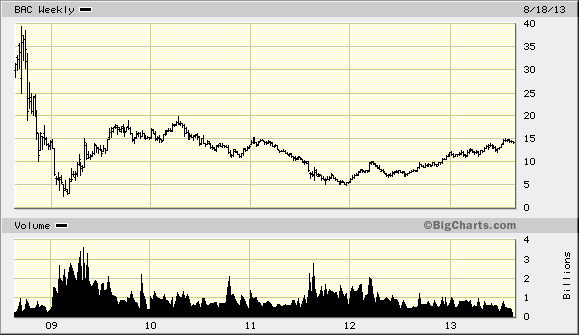
I also have done very well in this stock, buying when the price was severely depressed.
I don’t think we need to go into as much detail here because you can see the same issue. I would have purchased several times on the way down in late 2008 and the results would have been horrible. There was also an opportunity in mid-2011 that would ultimately have been profitable, but it wouldn’t have made up for the huge losses this formula would have produced in 2008-2009.
This chart also reiterates how important that “sell” criteria will be.
Finally, let’s look at something a little closer to now:
Carnival Cruise Lines (CCL)
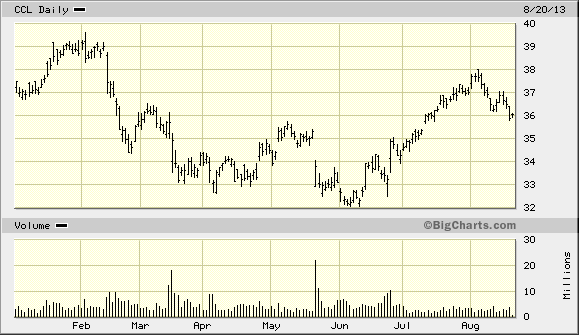
I purchased shares of CCL when the ship limped into shore without power earlier this year. Here is the chart:
I know this chart appears to feature a stock price that jumps around far more than the other two above, but check out the time frame. This is a YTD chart instead of a 5 year piece. Assuming the same set of goals, my purchase of this stock would have hit at around $34. Then I would have purchased more at around $32.30. In this case, had I purchased at those times I would have been profitable. The drop in February looks significant, but the biggest loss days were only around 3% per day. If we’d expanded the algorithm to purchase based on a 5% drop over multiple days we would have found ourselves stuck with a loss.
So Far What Do We Know
Clearly, the 5% rule I’d laid out doesn’t work. In each of these stocks I would have lost my ass with automatic trading.
So our algorithm that stated
a) Find great company (need to be defined)
(when)
b) Stock price falls 5% over two days or less
c) Purchase stock (amount and restrictions need to be defined)
(then)
d) Hold until (needs to be defined)
…definitely, among many other things, needs a new “b” rule.
Rather than try to scour my brain for the perfect solution, let’s just let fly some easy options that might lead us to the best course of action. Here are my initial thoughts:
– What would happen if we didn’t purchase until the chart showed some upswing first?
– What if the stock had to fall 5% AND there had to be some thoughts around volume. Maybe we don’t buy until volume reduces to a reasonable level….maybe only 120% of “normal” trading activity.
– Are there any fundamental factors or other barriers that we could study which would give us a better trigger than just the stock price decline….for example: what if we said Stock price declines until PE ratio declines to “x” or “declines BY x.”
I love this approach. By writing out these options I can now attack them individually, fully knowing that if there is some truth, it’ll probably exist inside a combination of these options OR within an option I wouldn’t have considered if I’d just “thought about it” in my head.
Upswings
On Carnival, here’s the historical data. I’m going to take the difference between open and close to determine how much headway the stock made that day:
Feb 13th – 3%
Feb 14th + .9%
Feb 15th – .7%
Feb 19th (next open day) – .4%
Feb 20th – 2.4% (we’ve now reached our trigger of 5%, IF we change the 5% from “over 2 days or less” to instead assume that we have some trigger that adds stocks to the top of our “funnel” once they hit a 2.5 or 3% drop in a single day, rather than 5% in a day, that might also help our cause. Let’s check this out, also.) Closing Price = 35.43
Feb 21 +.5% Here’s our upswing day. = $35.36 …. with our new test, this is our “buy” day
Feb 22 + 1.1%
Feb 25 – 1.5%
Feb 26 – .3%
Feb 27 + 1.8%
Feb 28 + .4%
Mar 1 + .7%
March 4 + .7%
On March 5 – .2%
On March 6 – .3% Closing Price = 36.14
March 7 + .5%
March 8 – 1.5% Closing Price = 35.67
Let’s check out two initial “sell” strategies.
If we decide to sell after two consecutive down days, we would have yielded a decent return. If we waited for a -1% or more downturn first, we would have greatly cut into that return.
Verdict? Let’s Tweak our Theory:
If we modified the algorithm to:
Find quality stock (determine)
THEN
Stock watch triggers when more than 2.5% drop
IF stock loses 5% in next 5 trading sessions, BUY
Then SELL when there are two successive decline days
We would have scored a 2.2% gain in 10 days. While this seems like a lot of work for 2%, remember that this is an automatic program AND if this wins 5 times a year we’ve equaled the long term results of the S&P 500 without much hassle and in 50 days. Not bad….but still not worth the work yet. Trading costs would also eat into this return, but we’ll deal with that once we’re closer to a strategy that has some promise.
We might have some promise with this test. Let’s look at later declines in the stock price to test the new theory we’ve developed.
Back to the CCL chart. I’ll place it here for easier following:
Wow, check out this decline on 3/15 (only 7 days later). Let’s look at open/close on each day again….
Houston, we have a problem. In this case CCL would NOT have triggered a “watch” again, even though our chart shows another clear opportunity:
Why not?
Check this out. See the lines on the chart? The little nub on the left side represents the “open” of the stock and the num on the right side of each line represents the “close.” All of the damage in this stock over the next three downturns happen after hours. All of my analysis above is open/close.
I really needed to be evaluating previous close to current close to catch all of these opportunities.
Ouch. Sigh. Feels like time wasted.
Oh, but it isn’t, Stackers. It definitely isn’t wasted time.
What can we learn from this?
First, check out the research I’m doing before engaging in something unfamiliar. When you decide to invest, do your homework! All that we’ve found out so far is that most of my preconceived ideas are wrong! However, there’s definitely light at the end of this tunnel. By playing this game we’re learning more about technical data, an area that I haven’t paid much attention to in the past. Technical data, for those of you new to investing, is charts and graphs….how the stock price moves. Fundamental data (the stats that I pay far more attention to….and with good reason) revolves around the performance of the company….how much they earn, how much they profit, how they conduct operations. We’ll use fundamentals to choose good companies.
Second, while we haven’t yet invested, this type of research helps me gain more comfort about the company. If I do invest, I’ll know that Carnival Cruise Lines is a pretty volatile stock.
Your thoughts on our progress? Hit me up in the comments.


I like the way your thinking is progressing, but I have an issue with the statement “if this wins 5 times a year we’ve equaled the long term results of the S&P 500”. That assumes that there aren’t any misses mixed in there as well, and there will be misses no matter how good you are (and believe me Joe, I think you’re good!)
With that said, I’m starting to get an idea of what (I think) is the real purpose behind this series, and I like it. Keep it up.
Oh, Matt, come on….. You and I both know I’m not going to lose! 😉
I guess my question would be: do you need pre-defined steadfast rules to be successful with the buy while depressed strategy? Or can it be more of a high level approach that varies from stock to stock (especially considering the drivers for depression could be significantly different).
Great question. I’m making an algorithm that will automatically purchase shares in these companies (at least that was the original question three weeks ago….”can I?”). Historically, I’ve just purchased companies when I spotted these opportunities. I warned people then that this is neither responsible nor financial planning….we’re just tackling a problem that I’ve never known the answer to….which is “how do you build an algorithm?”
I do remember your disclaimer. I guess I was just asking because you seem to be putting a lot of time and thought into developing the algorithm and, personally, I don’t have any time or thoughts to spare! So, it was just me putting myself in your shoes and asking how I could simplify. I do see what you’re doing here and it’s interesting.
I love how the method is being refined. Finding the gaps is the best part of testing – like you said, it’s not time wasted. I’m excited to see how the time between close and open can be added into the algorithm (as this is way more granular than I usually get as a buy and hold index investor).
And thanks for the mention, Joe!
Believe me, dude, it’s far more granular than I am with my everyday investing…..
I think it’s going to be cool when I actually get to the algorithm part. I have no clue how I’m going to put this into an actual program to make trades…..
Maybe there’s some super smart dude on Fiverr who can make an app, or something. Even if it doesn’t work, hey, whatever…five bucks.
I don’t want to get too far ahead, but I’ll be using ThinkOrSwim to take care of the trading. Learning how to do that will be a blast!
I’m looking forward to following this series. I like how you’re refining your method because I’m learning from it and hopefully that’ll lead to benefits down the road.
I feel like every week we get a little closer to “something!” Thanks for following, John.
I started my own project like this in Sept ’14. It’s doing alright. I would love some recommendations on how to improve my algorithm.
http://Www.MyStockMachine.com
This is exactly the kind of intensity that totally intimidates me and keeps me away from the market. Joe, when you figure out a fool proof plan, you let me know, I’ll hand you some cash and you can have 10% of the profits. 🙂
You’re funny. As I mentioned when we started, this is neither responsible investing or recommended.
Part of this equation is showing the silliness of even trying to tackle something of this magnitude, especially when you can create decent returns without all of the hassle.
The other part of me loves tinkering with technical and fundamental data.
One of my favorite quotes about stuff like this comes from Niels Bohr (a physicist and contemporary of Heisenberg… you know, of the uncertainty principle). It goes:
“Prediction is very difficult, especially about the future.”
=)
I’d look at your criteria of what makes a “good stock”. That seems to be not so well defined.
Ha! One thing at a time. Let’s fix this problem then we’ll move to how we will fill the funnel.
My first thought on the idea was that if that kind of thing was possible, somebody would already be doing it. But then again, maybe others ARE already doing it, and just not putting it out there because they don’t want to share in the profits.
This is why I usually just pick index funds. I’m with Laurie and if you figure it out, I’ll copy the formula, giving you all the credit, of course.
That’s my goal, Kim….make you a money making formula. 😉